Our electricity consumption

I just did a couple of calculations of our electricity consumption.

For the first calculation I used the total number of days our system has been running (1,695) and the total energy consumption (4,765 kWh) to get 2.81 kWh/day.  But we have been away for some of that time (say three months), so I subtracted 90 days = 2.96 kWh/day.

Even then, there has been only one person here for some of that time, maybe around 5-6 months, so 2.96 is an under-estimate of our average energy usage.  More relevant is the fact that until around late 2010 we were living in what is now the office, so fewer lights, no load from the fridge for most of that time because we used a gas fridge, and for much of the time, no washing machine. When we did get a washing machine, quite late in our shed-living days, it was a very old one that was about to be dumped by the neighbour of a friend, so had very high energy consumption.

We don’t keep a note of our meter readings (though we should), so it isn’t possible to track changes in electricity use over time. But I do have meter readings for today and two weeks ago, so can do the sums for that period – it comes out at a surprising 4.57 kWh/day.

Why surprising? Well, almost all our lights are 5W LED downlights, and they are set up in “banks” or as individual work bench lights so that their usage can be minimised. (Though they are rated at 5W, an energy meter on a bank of five in the office shows that their average power usage is 6W per LED).  This is probably mostly a result of losses in the 50W transformers that we use (each of which has a maximum of 10 LEDs connected to it).  Even with no lights turned on, each transformer uses 4.4W continuously, probably through hysteresis in the iron core, so for the four transformers that are constantly on we are using (losing) just over half a kWh per day.

Another reason for the higher than expected power use is that this is summer, and we have been having heat waves off and on for weeks, so the fridge has probably been running much more than usual.  It is a Vestfrost with separate compressors (and separate doors) for the fridge and freezer components, so is pretty economical.  When we bought it, it was way ahead of even the most economical of the commonly available brands.  However now there are quite a few models with similar storage space that are, on paper at least, are equal or better.   It’s set up in front of the pantry, so there is plenty of space behind it, and the gap between the top of the fridge and the ceiling is 2-3 metres, so there is plenty of vertical air circulation.

Our 1.98kW solar array on the roof of the "office"

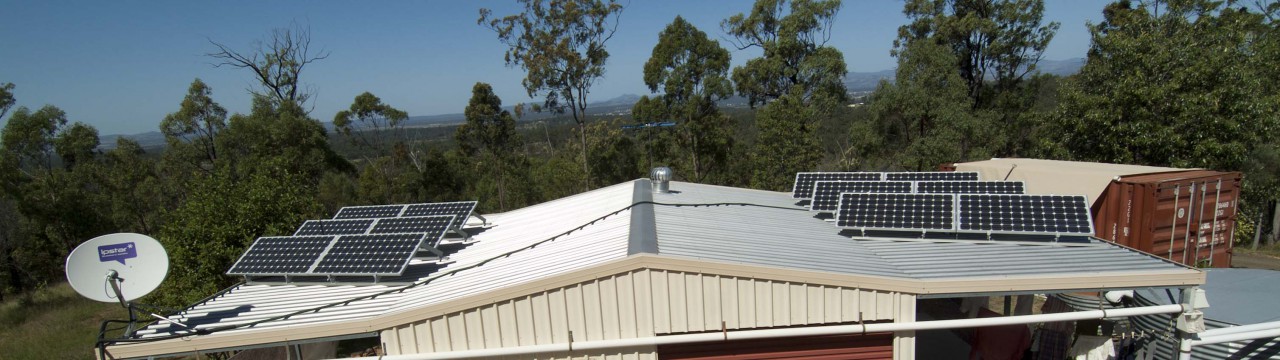
Our 1.98kW solar array on the roof of the “office”

We aren’t too worried about this level of energy use on our part, because we are on off-grid solar.  All of our power comes directly from solar panels during most of sunny days, and from a large battery bank during the night or cloudy parts of the day.  The battery bank consists of 24 two-volt 650 amp hour gel batteries.

Our solar PV system has a design load of 5.4 kWh/day – based on our estimated usage at the time of 3.95 kWh/day.  Since most of the power we use comes directly from the solar panels (fridge, washing machine, tools and computers are operating mostly during the day when the solar panels are producing much more then we use at any one time), our current 4.57 kWh daily usage represents a much smaller load on the batteries and leaves us plenty of leeway within our design load.

We manage our batteries so that they don’t go below 80% capacity, and even with this conservative management approach we need to turn on the generator to recharge the battery bank fewer than three times per year on average.  With gel batteries and this low level of draw-down we expect to get 15 years or more out of our batteries.

Though I say that we aren’t too worried about our level of electricity consumption, we do try to minimise our use, just because it feels right – and because one of our objectives in living where and how we do is to demonstrate a range of approaches to sustainable living.  I’ll deal with other ways in which we strive for sustainability in other posts.

In the meantime we can get some satisfaction from the fact that our level of electricity consumption is nowhere near the average 13.9 kWh/day of two-person households in our postcode area.

Solar Feed-in Tariffs – how essential was it to get rid of them?

Australian governments at Federal and State level had a collective rush of blood to the head over the last two years and dropped solar PV feed-in tariffs to levels that are only a fraction of what they were two years ago.

No doubt this was largely inspired by a combination of pressure from power companies, surgent neo-liberal philosophy reinforced by a drive to achieve budget surpluses, and panic in the face of the rapid increase in domestic solar PV installations – yikes!! the policy is working – not something that the current Federal government is used to seeing.

The level of installed domestic solar PV in Australia increased dramatically in 2010-2012.  The graph below shows the change up to 2011, and it continued at the same rate into 2012.

Take up of solar PV in Australia.  Circles show total installed capacity, rectangles show new capacity installed in the given year. [Data from DataMarket (http://data.is/naKtrl), image by Mike Sandiford. Figure in this blog from link to: http://theconversation.edu.au/whos-afraid-of-solar-pv-8987%5D

Yes, people did continue to install grid-connected solar power, but not at the levels they would have done with the incentive of higher feed-in tariffs.

Does this matter?  Well, yes, very much so, given that the rate at which the world has been generating greenhouse gases means that we have to totally phase out the use of fossil fuels over the next two decades if we are to have any chance of avoiding 6 degC of global warming by the end of the century.(#)

An investment in higher solar power feed-in tariffs for few years now would have very significantly reduced the use of fossil fuels for electricity generation now and into the future, and would have bought time to find alternatives so that we could replace existing fossil fuel generating plants with non-fossil fuel generation.

Japan, a country which has been in more or less permanent recession for 20 years and which, as a result of very significant ongoing tsunami reconstruction expenses, has every reason to cut other budget programs would seem an unlikely country to introduce or maintain high solar feed-in tariffs.

A member of the Alternative Technology Association‘s Brisbane group reported on their discussion group today that large Sharp solar panels (made in Japan) have been becoming increasingly difficult to source in Australia.  Here’s what he said:

Sharp 167W 24V poly panels have been almost impossible to get all year.  185W 16V mono panels have been easier but not available from usual channels for the last 6 months or so.
Sharp is no longer importing their made in Japan panels into Australia because they are instead servicing the world leading Japanese feed in tariff of over 50c/kWh L. [sorry can’t give you a link, you have to be a member to access the discussion group]

In fact, the Japanese government has, for a long time, been seeking to expand solar power by enacting subsidies and a feed-in tariff. In December 2008, the Ministry of Economy, Trade and Industry announced a goal of 70% of new homes having solar power installed, and would be spending $145 million in the first quarter of 2009 to encourage home solar power.

The Japanese government enacted a feed-in tariff on November, 2009 that requires utilities to purchase excess solar power sent to the grid by homes and businesses and pay twice the standard electricity rate for that power. In that year, Japan had the third largest solar capacity in the world (behind Germany and Spain), with most of it grid connected

On June 18, 2012, despite being in the top five globally for installed PV, a new feed-in tariff was approved, of 42 Yen/kWh, about 0.406 Euro/kWh or USD 0.534/kWh. The tariff covers the first ten years of excess generation for systems less than 10 kW, and generation for twenty years for systems over 10 kW. It became effective July 1, 2012. (Source: Solar Power in Japan – Wikipedia)

But here in the Lucky Country, raking in the taxes and royalties from a mining boom, the government thinks we can’t afford higher feed-in tariffs, even to protect our grandchildren from globally destructive chaos.

__________________

# There are a lot of recent sources to back this up, but you could start with:

http://www.huffingtonpost.com/tom-zeller-jr/climate-change-math-politicians_b_2147001.html and www.guardian.co.uk/environment/2011/nov/09/fossil-fuel-infrastructure-climate-change [see particularly the paragraph beginning: The new research adds to that finding…]

Lockyer up with the best in Australia on level of solar PV power installations

A new report by Sunwiz has revealed that the Federal electorate of Wright (containing all or most of the Lockyer Valley Region) has the highest number of domestic solar power installations (solar PV plus solar hot water) of any Federal electorate in the country.  SunWiz has performed an analysis of Clean Energy Regulator data as of 1 October 2012 to identify the top solar electorates.

The electorate of Wright has a total of 26,417 installations, made up of 16,420 solar PV and 9,998 solar hot water systems.

Of course, raw figures on the number of installations in an electorate are not particularly meaningful, given that there is some variation in household numbers per electorate (though electorates generally have populations of around 150,000).  The percentage of households with solar installations (known as “penetration”) is a much more useful number, both for comparison and for revealing the level of uptake of renewable energy at the household level.

Wright figured 6th in level of penetration of solar PV (out of 150 electorates) with a penetration level of 20% – one in five dwellings (the national maximum was 23%) and 15th in solar hot water with 12% – one in eight (national maximum 21%).

The electorate of Wright encompass an area stretching from the western Gold Coast through the rural areas left out of the more urban electorates between Logan City and the NSW border, before curving northwest to include the Lockyer Valley Region west of Ipswich. As well as the western edge of the city of Gold Coast, Wright includes the towns of Beaudesert, Jimboomba, Boonah, Gatton, Laidley, Hatton and Helidon (ABC 2010 election web site).

Given its location, Wright may not be what you would think of as a particularly Green electorate, and it isn’t, though there was a significant swing to the Greens in the 2010 election.  Conservative parties (LNP, ALP and Family First) – yes, I’ve identified the ALP as a conservative party – got over 80% of the vote.  The voting pattern in that election was:

How does the Lockyer Valley Region fit into this solar power picture?

Census records for the Lockyer Valley Region do not include solar PV installation data.  However it doesn’t seem unreasonable to take the 4343 postcode area as a proxy for the Region.  As can be seen from the map below, it clearly takes up a significant proportion of the Region.

The Sunwiz analysis is based on postcode data (their methodology is explained at the foot of the web page reporting their findings), but understandably in a national report they do not provide the separate postcode data.

The Clean Energy Regulator’s web site includes detailed data on “small generation units” (= solar panel installations) for each postcode area.  In the 4343 area 677 units had been installed as of October 2012, with a total generating capacity of 2,012 kW.  The total is likely to be higher than this because the data is based on registration for Renewable Energy Certificates, which can be done up to 12 months after installation.

There were 3,610 occupied private dwellings in the 4343 postcode area at the time of the 2011 Census.  This suggests a “penetration” of solar PV power of 18.7%.  However, solar power is seldom installed on apartments, flats, and similar, and is much more likely to be found on private houses, of which the Census recorded 3,190, leading to a penetration level of 21.2%.  It seems fair enough to say that the solar PV penetration level in the 4343 postcode area is between 18.7% and 21.2%, and that the level for the Lockyer Valley Region is probably in this range.  (There were 11,900 private dwellings, and 11,200 occupied private houses recorded in the Region in the Census, so the 4343 figures represent 30.3% and 28.9% respectively of these totals. Seems like a pretty good sample).

What this means is that the penetration level for solar PV power installation in the Lockyer Valley Region (around 18.7-21.2%) is clearly of the same order as that for the larger Wright electorate (20%) and close to the highest penetration rate in the country (23%).

Let’s take a walk around our systems

How about a quick tour for a preview of some of our different life support systems?  Solar power first.  There are 12 panels making up a 1.9 kW array feeding into a battery bank that lasts up to three days without sun.  The building was our home for nearly ten years, and has now been lined, insulated and fitted out as a study and TV room with a guest bed.  Much more comfortable than when we lived in it.  The container at the back is currently a storage area, but there are plans to eventually convert it into guest accommodation.  I’ve always been fascinated by the idea of using shipping containters as the basis for housing.

On the righ of the photo you can make out one of our water tanks. This one is “aquaplate”, but the others are mainly stainless steel.  The dish on the left is for satellite broadband internet access.  Our phone line can’t handle any but the lowest data transfer speeds and certainly isn’t up to delivering modern internet content.

Then there is the house, with its passive solar design. The tall windows and wide eaves on the north-facing wall allow winter sun to shine across half the width of the house at midday in mid-winter.  The heat of the sun is absorbed by the concrete and is returned to the interior during the night.  Lots more features of the house to talk about later, like the insulation and lighting.  And the whole story of our owner-building journey.

On the right you can see the first flush diverters coming down the corner of the wall.  These discharge the first flow from the roof and gutters to the ground, preventing accumulated dust and dirt from entering the storage tanks.

This is the smallest, lowest impact house we could build within the constraints of our space requirements, the design demands of bushfire safety considerations, and government building regulations.

We use composting toilets, both inside and outside the house.  Manure of any kind is too valuable a resource to waste.  Once full, the bin is moved to the back, stocked with compost worms and left to mature until the other bin is near full.  This can be up to 12 months, by which time the resting bin has produced about 150 litres of friable, rich soil ready to go into the garden beds.  In this photo the bin on the left is covered with shade cloth to stop it getting too hot in the summer sun.

Before we built the house we had a very productive greywater treatment system comprising a worm farm, a sand filter and a storage tank.  Not only did it produce water for the garden that was clean enough to store for 3-4 days without any smells, it also produced thousands of compost worms and lots of worm castings to fertilize the garden beds.  Alas, plumbing regulations do not allow such productive creativity, so now we are fully legal, and our greywater all goes to waste, literally.  It is discharged under the ground in an absorption area, out of reach of our gardens and fruit trees.

The loss of this greywater matters in our dry climate.  One of the solutions we are trying in order to save water is the use of wicking pots to grow vegetables.  In this method water is stored in the bottom of the pot, and wicks up through the soil to the root zone.  The only water that escapes is what is transpired through the leaves of the plants.  Depending on the size of the plants and the weather the water needs topping up only every four to seven days.

We also have small portable worm farms, producing useful quantities of worm castings and worm tea, and a worm farm that processes the discharge from our kitchen sink before it enters the greywater system.  At present we are thinking about designs for a vermiponics system (worm farms connected to flood-and-drain vege grow beds).  If these are successful they will become the precursor to a full-fledged aquaponics system, with native fish tanks connected to the grow beds, but that’s some way in the future.

Well, that’s a quick introduction to some of our life support systems.  I hope it has whetted your interest.  There will be separate posts on each of these systems as time allows.  Of course there are other systems that I haven’t touched on heree, including: a range of approaches to compost making, the wood-fired heating (for those few winter nights when the passive solar doesn’t quite overcome the cold), and the solar hot water. Those will be the sugject of future posts – possibly many posts, because most of our systems are in a process of ongoing development and improvement.